Share
Project 1: Construct the simple two-bus power system as shown in Figure 1. The nominal system voltage is 20-kV. Bus 1 is the system slack bus. Figure 1 1. Construct the network of one-line diagram based on the specifications given in the diagram from Fig.1. On the diagram, put the labels showing the following: (a) Active, reactive and apparent powers generated by the generator (b) Transmission Losses in term of MW and Mvar (c) Bus 1 and 2 voltages (in kV) (phase angle in degree) 2. When the output of the shunt capacitor is 0-Mvar solve and run the network and activate animation to show both MW and Mvar power flow. 3. Observe what happens when the MVA limit of the transmission line is 20 MVA. Comment on the result. Set the limit of the transmission line back to 40 MVA. 4. Observe the transmission line loss when its series resistance and reactance are changed to 0.4 and 0.8 pu. Observe the bus voltages and comment on the voltage regulation. 5. Change the line impedance back to its original value. Vary the reactive power of the shunt capacitor in steps from 0 to 20 Mvar. At each step, record the voltage at bus 2 and the transmission line losses. Plot the results and Page 1 of 12 Page 2 of 12 COLLEGE OF SCIENCE AND TECHNOLOG Y COLLEGE OF SCIENCE AND TECHNOLOGY determine the situation when optimal voltage regulation is achieved (Use Excel to plot the results). 6. Assume that half the time the load is 25 MW/14 Mvar, and for the other half it is 30 MW/18 Mvar. What single value of Qcap would minimize the average losses? Assume that Qcap can only be varied in 0.5 Mvar steps. Capacit or Bus 2 Transmission Losses Mvar Voltag e Ploss Qlo ss
ReportQuestion
Please briefly explain why you feel this question should be reported.
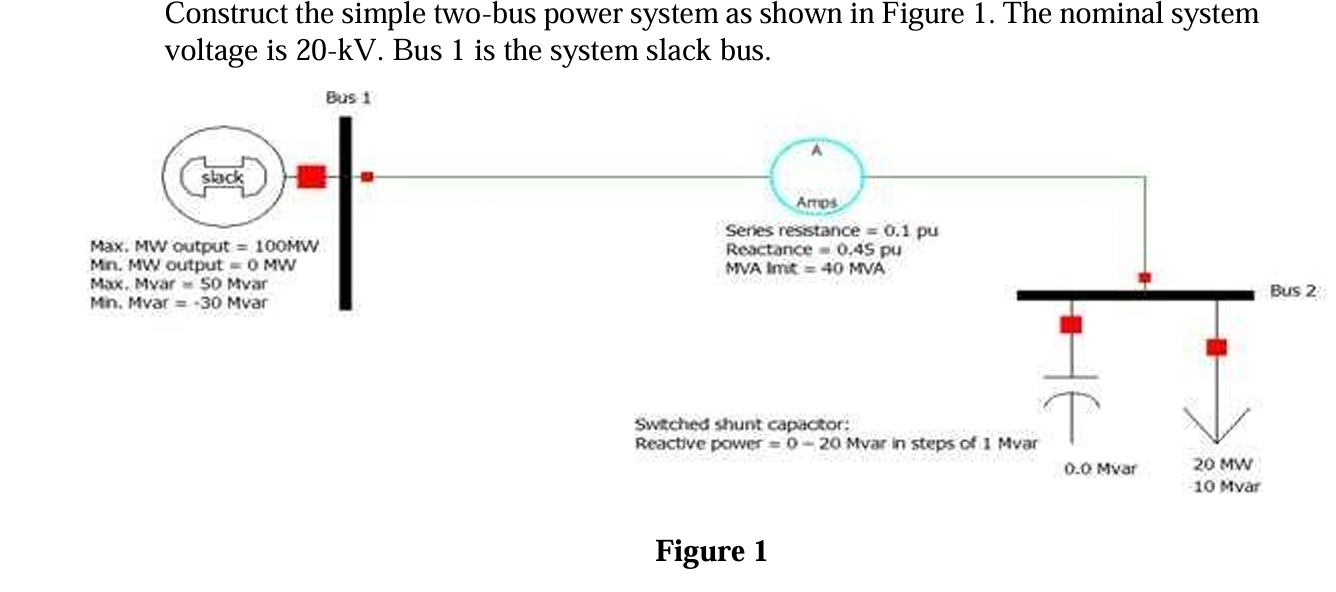
Construct the simple two-bus power system as shown in Figure 1. The nominal system
voltage is 20-kV. Bus 1 is the system slack bus.
Figure 1
1. Construct the network of one-line diagram based on the specifications given in
the diagram from Fig.1. On the diagram, put the labels showing the following:
(a) Active, reactive and apparent powers generated by the generator
(b) Transmission Losses in term of MW and Mvar
(c) Bus 1 and 2 voltages (in kV) (phase angle in degree)
2. When the output of the shunt capacitor is 0-Mvar solve and run the
network and activate animation to show both MW and Mvar power flow.
3. Observe what happens when the MVA limit of the transmission line is 20
MVA. Comment on the result. Set the limit of the transmission line back to 40
MVA.
4. Observe the transmission line loss when its series resistance and
reactance are changed to 0.4 and 0.8 pu. Observe the bus voltages and
comment on the voltage regulation.
5. Change the line impedance back to its original value. Vary the reactive power
of the shunt capacitor in steps from 0 to 20 Mvar. At each step, record
the voltage at bus 2 and the transmission line losses. Plot the results and
Page 1 of 12
Page 2 of 12
COLLEGE
OF SCIENCE
AND
TECHNOLOG
Y
COLLEGE OF SCIENCE
AND TECHNOLOGY
determine the situation when optimal voltage regulation is achieved (Use
Excel to plot the results).
6. Assume that half the time the load is 25 MW/14 Mvar, and for the other
half it is 30 MW/18 Mvar. What single value of Qcap would minimize the
average losses? Assume that Qcap can only be varied in 0.5 Mvar steps.
Leave an answer