Share
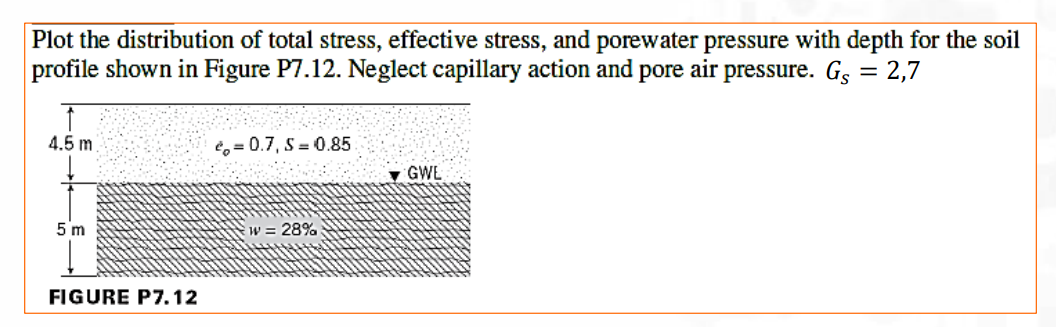
Plot the distribution of total stress, effective stress, and porewater pressure with depth for the soil profile shown in Figure P7.12. Neglect capillary action and pore air pressure. Gs = 2,7
ReportQuestion
Please briefly explain why you feel this question should be reported.
Plot the distribution of total stress, effective stress, and porewater pressure with depth for the soil
profile shown in Figure P7.12. Neglect capillary action and pore air pressure. Gs = 2,7
Leave an answer
Sorry this question is closed .