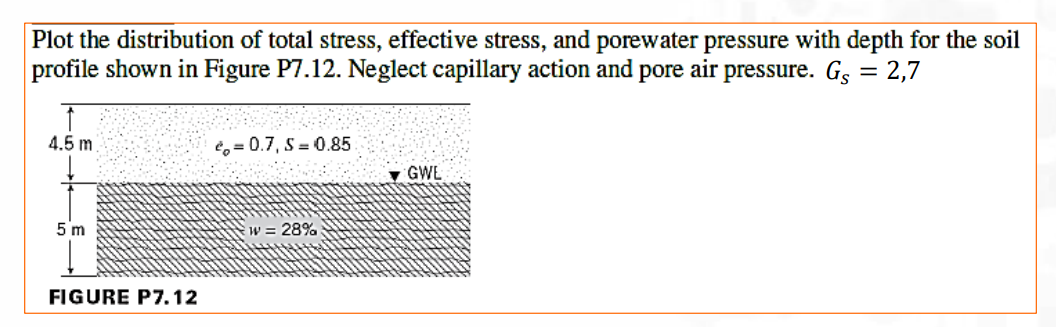
Plot the distribution of total stress, effective stress, and porewater pressure with depth for the soil profile shown in Figure P7.12. Neglect capillary action and pore air pressure. Gs = 2,7
ReportQuestion
LEONARDOACHAGUA

Plot the distribution of total stress, effective stress, and porewater pressure with depth for the soil
profile shown in Figure P7.12. Neglect capillary action and pore air pressure. Gs = 2,7