Sorry it's a private question.
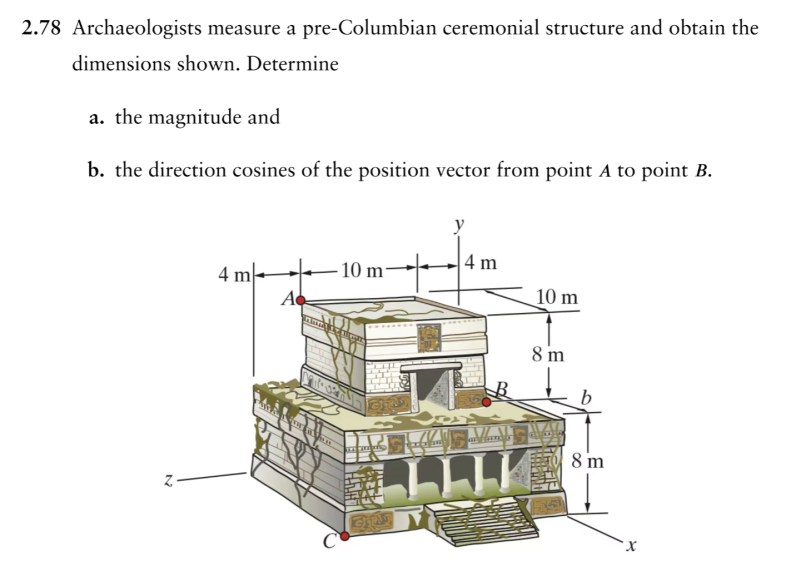
Problem 2.78 Archaeologists measure a pre-Colum- bian ceremonial structure and obtain the dimensions shown. Determine (a) the magnitude and (b) the direction cosines of the position vector from point A to point B. 4 m. -10 m 10 m 8 m B 8 m
ReportQuestion
Chemical Process and Principles

Problem 2.78 Archaeologists measure a pre-Colum- bian ceremonial structure and obtain the dimensions shown. Determine (a) the magnitude and (b) the direction cosines of the position vector from point A to point B. 4 m. -10 m 10 m 8 ...
Please briefly explain why you feel this question should be reported.
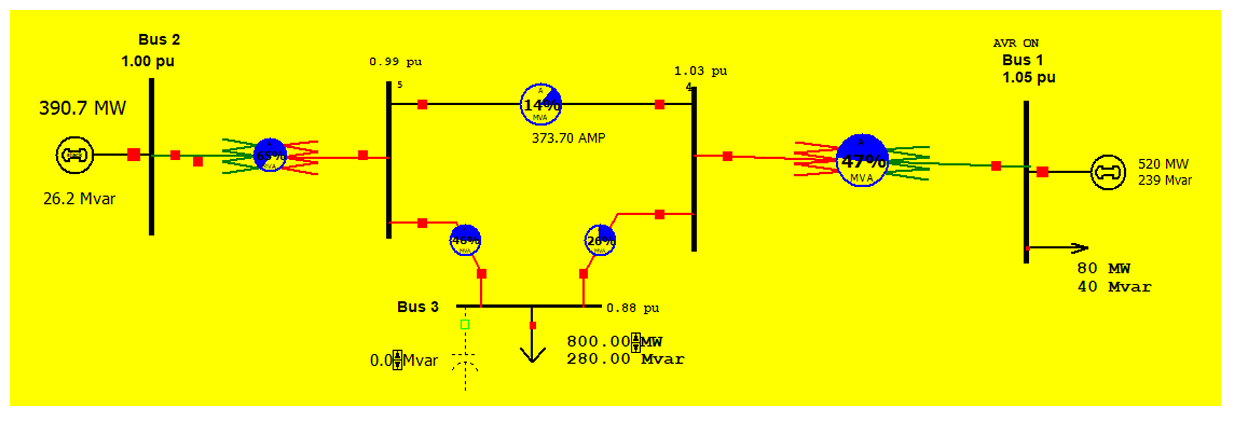
1. Using the PowerWorld Simulator, create three input data files: bus input data, line input data, and transformer input data as shown in Figure 4. Note that bus 1 is the swing bus. Your output for this part consists of three power-flow input data files. 2. Run the power flow program and obtain the bus, line, and transformer input/output data files that you prepared in Part 1. 3. The Bus voltage magnitude should be between 0.98 < V < 1.03 per unit at all buses during both light and heavy loads. Find two settings for the compensation, one for light and one for heavy loads. Hint: Use Shunt Compensation.Case 1: Normal condition Case 2: Light Load Condition (60%) Case 3: Heavy Load Condition (120%) along with a one-paragraph explanation of your methods for increasing/decreasing the voltage at all buses within the range. 4. Compute subtransient fault currents for a bolted three-phase-to-ground fault at bus 2, 5 ,6, and transmission line L5-6. Also compute bus voltages during the faults and the positive- sequence bus impedance matrix. Assume 1.0 per-unit prefault voltage. Neglect prefault load currents and all losses. Your output for this part consists of three input data files and three output data (fault currents, bus voltages, and the bus impedance matrix) files. 5. Compute sub-transient fault currents for (1) single-line-to-ground, (2) line-to-line, and (3) double line-to-ground bolted faults at bus 2, 5 ,6 and transmission line L5-6. Also compute the zero-, positive-, and negative-sequence bus impedance matrices. Assume 1.0 per-unit prefault voltage. Also, neglect prefault load currents and all losses. 6. By using this simulator, the user can determine whether the given system can still operate under an acceptable state in certain contingencies. Assume the bus voltages should be maintained within +10% of the rated voltage. Investigate whether the system will remain secure: 1. When the transmission line between buses 4 and 6 is out of service. 2. When the transmission line between buses 2 and 5 is out of service. 3. When the transformer between buses 3 and 4 is out of service. 4. When the Generator at bus 1 is out of service
ReportQuestion
jmvunique


1. Using the PowerWorld Simulator, create three input data files: bus input data, line input data, and transformer input data as shown in Figure 4. Note that bus 1 is the swing bus. Your output for this part consists of ...
Please briefly explain why you feel this question should be reported.
Let f(x,y),0≤x,y≤1, satisfy the following conditions: for each x,f(x,y) is an integrable function of y, and (∂f(x,y)/∂x) is a bounded function of (x,y). Show that (∂f(x,y)/∂x) is a measurable function of y for each x and dx d ∫ 0 1 f(x,y)dy=∫ 0 1 ∂x ∂ f(x,y)dy
ReportPoll
chun

Let f(x,y),0≤x,y≤1, satisfy the following conditions: for each x,f(x,y) is an integrable function of y, and (∂f(x,y)/∂x) is a bounded function of (x,y). Show that (∂f(x,y)/∂x) is a measurable function of y for each x and dx d ∫ ...
Please briefly explain why you feel this question should be reported.
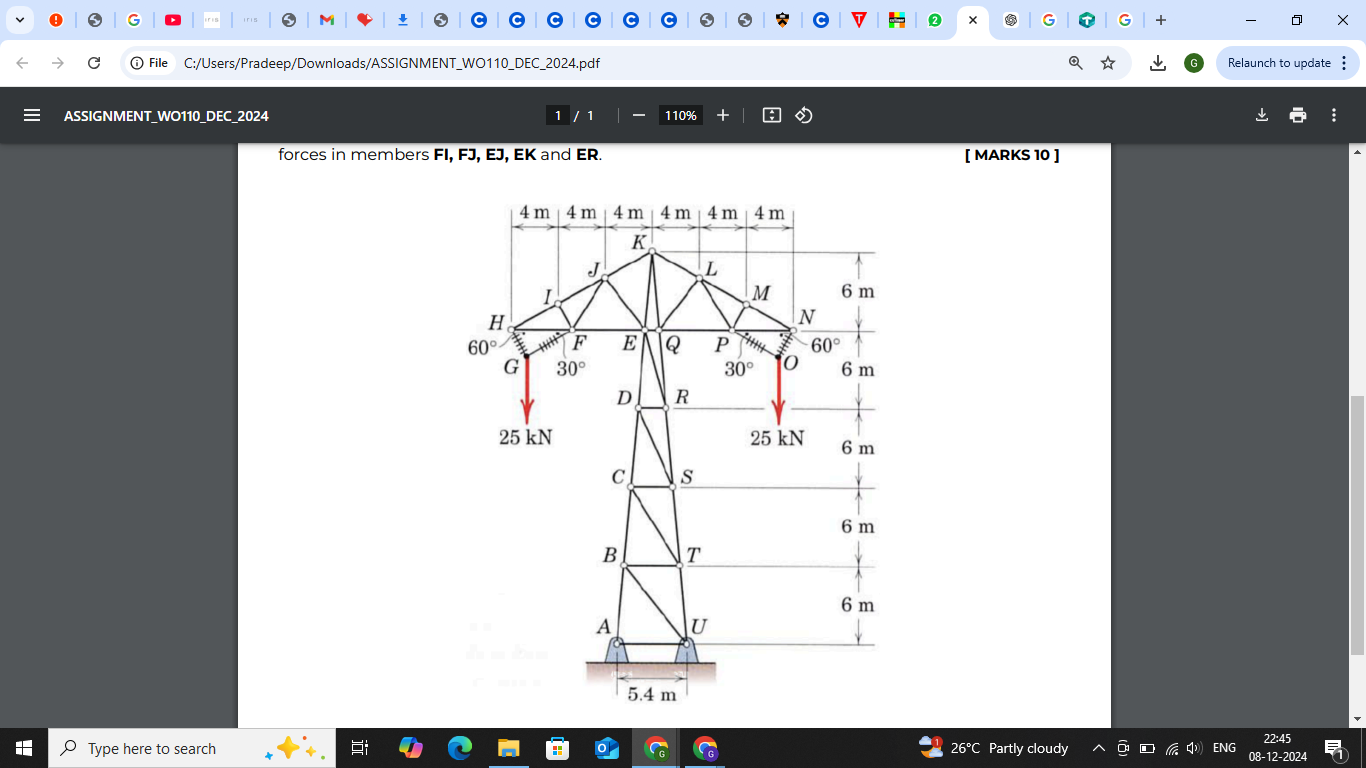
)A design model for a transmission line tower is shown in the gure. Members GH, FG, OP and NO are insulated cables; all other members are steel bars. For the loading shown, compute the forces in members FI, FJ, EJ, EK and ER.
ReportQuestion
blehbleh

Please briefly explain why you feel this question should be reported.
One-line diagram, together with the bus and line data, of a 5-bus power system is shown below; the system will be referred to as utility A. Solve the following problems using the PowerWorld Simulator. 1. For the power system of utility A, use the PowerWorld program to find the MVAr rating of a shunt capacitor at bus 3 that increases V3 to 1.00 p.u. Determine the effect of the capacitor bank on the line loading and total I2R losses. 2. Run the original power flow for utility A. Do you find any voltage violations? (The normal range of bus voltages is assumed to be 0.95-1.05 p.u.) Now suppose both transformers in this system are tap changing transformers whose taps can be varied from 0.85 to 1.15 p.u. in increments of 0.05 p.u. Determine the tap settings required to increase the voltage at bus 3 to 0.95 p.u., while causing as few high voltage violations as possible at the other buses. 3. A new transformer is installed between buses 2 and 5, in parallel with the existing transformer between buses 2 and 5. The new transformer is identical to the existing transformer. The taps on both transformers are set to the nominal value, 1.0 p.u. Find the real power, reactive power and MVA supplied by each of these transformers to bus 5. 4. Refer to the one-line diagram of utility A. Suppose an additional line is installed between buses 3 and 4. The line parameters of the added line are equal to those of the existing line 3-4. Determine the effects on the voltage at bus 3, line loading and total I2R losses. 5. In problem 2 you already ran the power flow for utility A and detected low voltage violations. Place a capacitor at bus 3 to bring the bus 3 voltage up to 0.95 p.u. Determine the size of the capacitor bank. Now suppose the line between buses 3 and 5 is removed for maintenance. Run the power flow again. Is the operating condition acceptable? If not, determine the amount of load you have to shed at bus 3 in order to maintain the bus 3 voltage above 0.95 p.u. Cut the same percentage of MW and MVAr at bus 3.
ReportQuestion
jmvunique
One-line diagram, together with the bus and line data, of a 5-bus power system is shown
below; the system will be referred to as utility A. Solve the following problems using the
PowerWorld Simulator.
1. For the power system of ...
Please briefly explain why you feel this question should be reported.
Project 1: Construct the simple two-bus power system as shown in Figure 1. The nominal system voltage is 20-kV. Bus 1 is the system slack bus. Figure 1 1. Construct the network of one-line diagram based on the specifications given in the diagram from Fig.1. On the diagram, put the labels showing the following: (a) Active, reactive and apparent powers generated by the generator (b) Transmission Losses in term of MW and Mvar (c) Bus 1 and 2 voltages (in kV) (phase angle in degree) 2. When the output of the shunt capacitor is 0-Mvar solve and run the network and activate animation to show both MW and Mvar power flow. 3. Observe what happens when the MVA limit of the transmission line is 20 MVA. Comment on the result. Set the limit of the transmission line back to 40 MVA. 4. Observe the transmission line loss when its series resistance and reactance are changed to 0.4 and 0.8 pu. Observe the bus voltages and comment on the voltage regulation. 5. Change the line impedance back to its original value. Vary the reactive power of the shunt capacitor in steps from 0 to 20 Mvar. At each step, record the voltage at bus 2 and the transmission line losses. Plot the results and Page 1 of 12 Page 2 of 12 COLLEGE OF SCIENCE AND TECHNOLOG Y COLLEGE OF SCIENCE AND TECHNOLOGY determine the situation when optimal voltage regulation is achieved (Use Excel to plot the results). 6. Assume that half the time the load is 25 MW/14 Mvar, and for the other half it is 30 MW/18 Mvar. What single value of Qcap would minimize the average losses? Assume that Qcap can only be varied in 0.5 Mvar steps. Capacit or Bus 2 Transmission Losses Mvar Voltag e Ploss Qlo ss
ReportQuestion
jmvunique
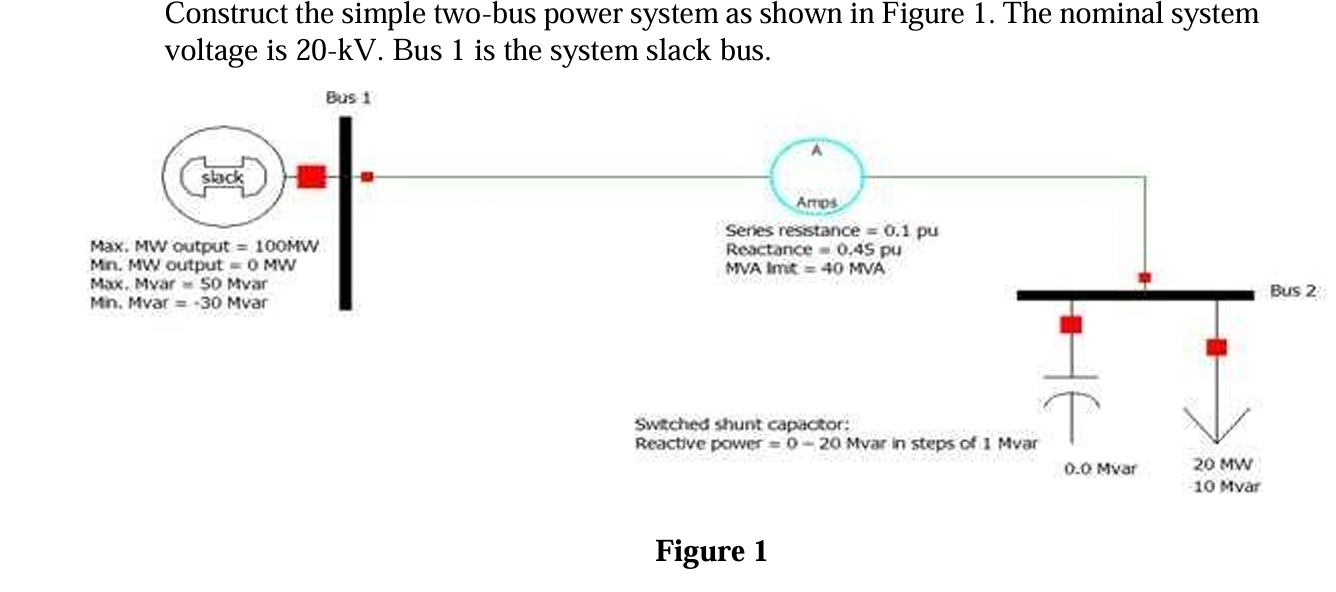
Construct the simple two-bus power system as shown in Figure 1. The nominal system
voltage is 20-kV. Bus 1 is the system slack bus.
Figure 1
1. Construct the network of one-line diagram based on the specifications given in
the ...
Please briefly explain why you feel this question should be reported.
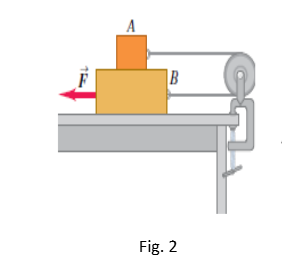
Fig. 3 shows the top view of a car which has mass 1000 kg. The car is acceleration on a frictionless surface by the three forces as shown in the fig. 3. Find the magnitude and direction of the acceleration of the car.
ReportQuestion
noborotno

Physics
Please briefly explain why you feel this question should be reported.
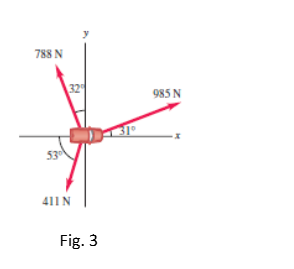
Block A in Fig. 2 weighs 1.90 N, and block B weighs 4.20 N. The coefficient of kinetic friction between all surfaces is 0.30 and applied force 𝐹 ⃗⃗⃗ has magnitude of 10N. Block A and block B are connected by a light, flexible cord passing around a fixed, frictionless pulley. (a) Draw a complete free body diagram. (b) Find the acceleration of the block B.
ReportQuestion
noborotno
Physics Question