Share
Modeling, simulation and analysis of engineering
ReportQuestion
Please briefly explain why you feel this question should be reported.
Solenoid actuator-valve system
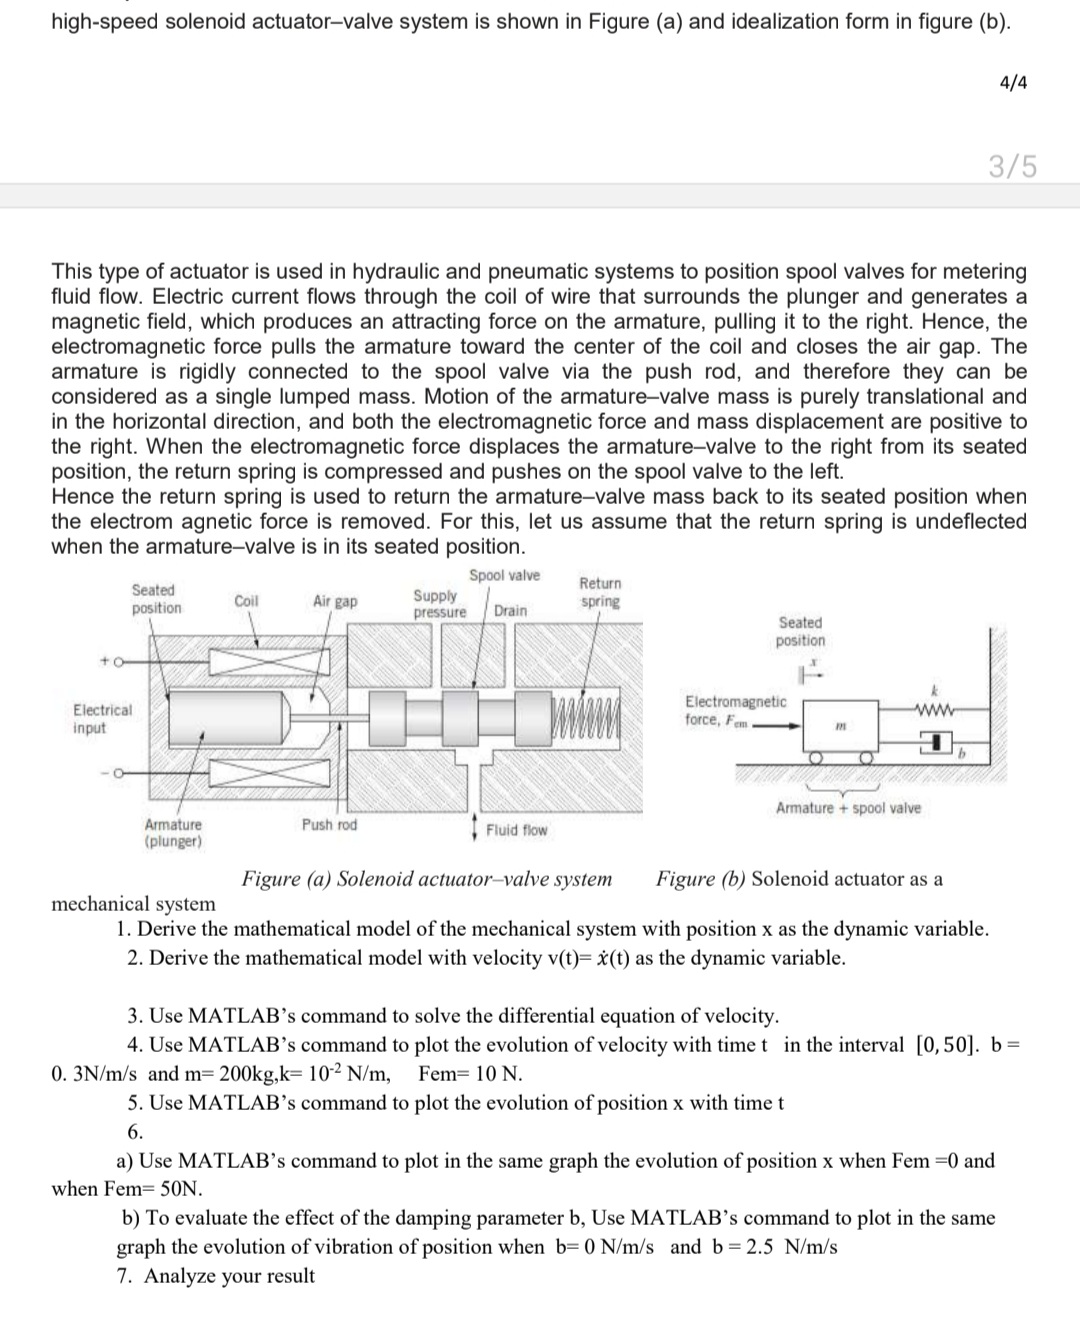
high-speed solenoid actuator-valve system is shown in Figure (a) and idealization form in figure (b).
This type of actuator is used in hydraulic and pneumatic systems to position spool valves for metering fluid flow. Electric current flows through the coil of wire that surrounds the plunger and generates a magnetic field, which produces an attracting force on the armature, pulling it to the right. Hence, the electromagnetic force pulls the armature toward the center of the coil and closes the air gap. The armature is rigidly connected to the spool valve via the push rod, and therefore they can be considered as a single lumped mass. Motion of the armature-valve mass is purely translational and in the horizontal direction, and both the electromagnetic force and mass displacement are positive to the right. When the electromagnetic force displaces the armature-valve to the right from its seated position, the return spring is compressed and pushes on the spool valve to the left.
Hence the return spring is used to return the armature-valve mass back to its seated position when the electrom agnetic force is removed. For this, let us assume that the return spring is undeflected when the armature-valve is in its seated position.
1. Derive the mathematical model of the mechanical system with position x as the dynamic variable.
2. Derive the mathematical model with velocity v(t) = dot x (t) as the dynamic variable.
3. Use MATLAB’s command to solve the differential equation of velocity.
4. Use MATLAB’s command to plot the evolution of velocity with time t in the interval [0,50]. b = 0. 3N/m/s and m = 200kg, k = 10 ^ – 2 * N / m Fem10 N.
5. Use MATLAB’s command to plot the evolution of position x with time t
6.
a) Use MATLAB’s command to plot in the same graph the evolution of position x when Fem =0 and when Fem = 50N
b) To evaluate the effect of the damping parameter b, Use MATLAB’s command to plot in the same graph the evolution of vibration of position when b = (0N / m) / s and b = (2.5N / m) / s
7. Analyze your result
Leave an answer